Synopsis
To get an overview over the license usage of Squish GUI Tester, the log messages of its floating license server can be used.
Some of these log messages contain the license usage. For example:
2025-04-14T22:14:29 [license_2] License usage: tester=1/10 executor=0/0 variable=0 total=1/10
Because of the format, the license usage information cannot be used by a tool like Microsoft Excel directly. Instead, the plain license usage numbers must be extracted, and then Microsoft Excel (or similar tools) can be used for visualizing the usage data.
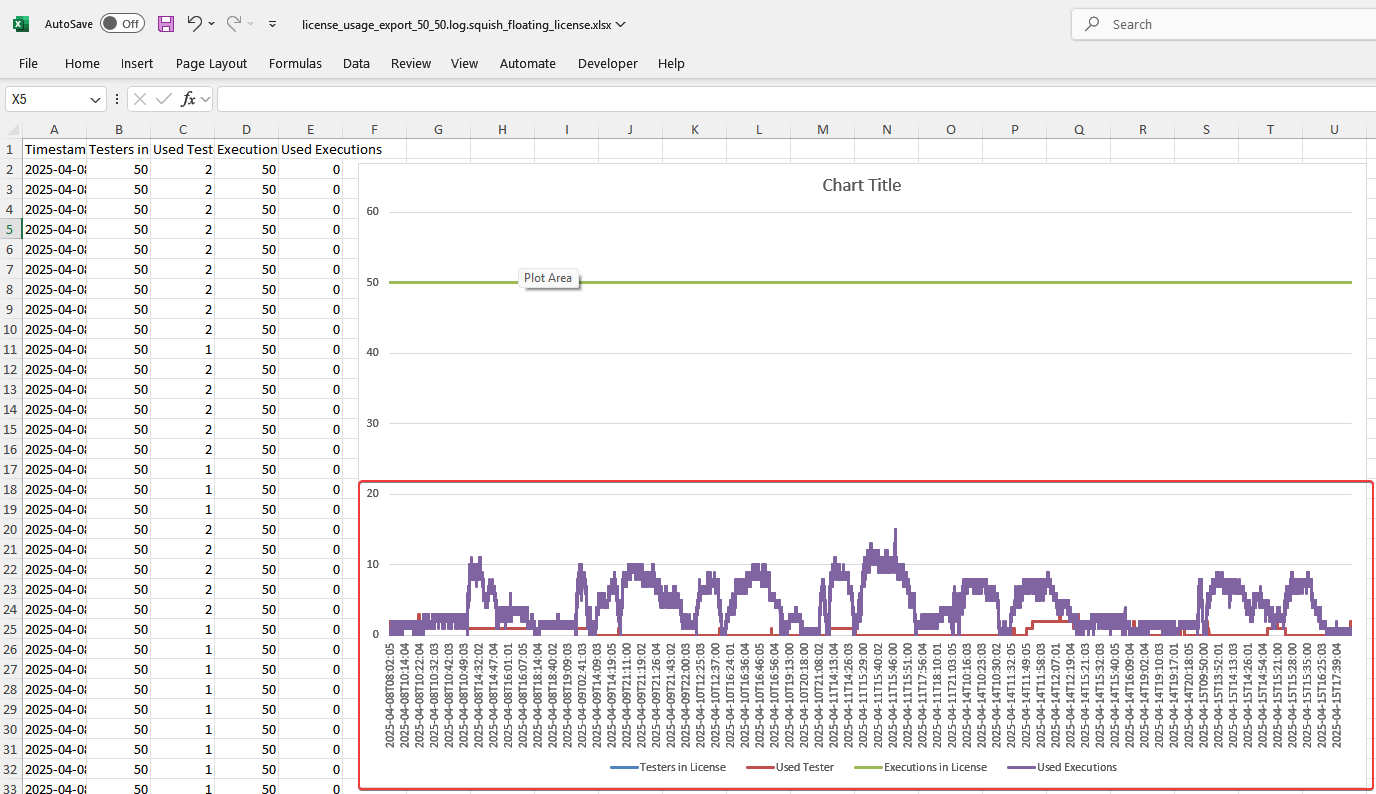
The following Python script extracts this data, and writes it into a file in Excel workbook format. Once loaded in Excel, the information can be visualized, for example via a line cart. How to do this is described below.
Generating the Excel Workbook File
NOTE:
The following information and instructions are meant for advanced computer users, for example system administrators.
Prerequisites
- Python 3 or higher, for example the Python 3 installation contained in a Squish GUI Tester installation folder.
- The Python module
openpyxl. This can be installed viapip install openpyxl. (In case of a Squish installation:squish_dir/python3/Scripts/pip install openpyxl.) - One or multiple of the Squish GUI Tester floating license server log files, or the log entries from the system log. (See License Server Logging .)
Caveats
- On Windows, the license server rotates its log files (see License Server Logging on Windows ), and so accessing the current log file may interfere with rotation. It is strongly recommended to stop the license server, copy the log files, and start the license server, to reduce risk of interference.
- On Windows, the default log rotation may have too few rotations and/or log files with too small sizes to contain the desired usage information over the desired period of time. (Configure this for the Window service in the registry at
HKEY_LOCAL_MACHINE\SYSTEM\CurrentControlSet\Services\squish-license-server,ImagePath, in parameters--log-file-sizeand--log-file-count.) - The Squish GUI Tester floating license server can host multiple license configurations. The usage data for each license (configuration) will be written into a separate Excel file (file extension
.xlsx), and the file name will contain license name.
Step 1 - Download Script
Download the script
squish_license_usage.py
into a folder with write access, say C:\Users\myuser\squish_license_usage.
Step 2 - Start a shell or Command Prompt (cmd.exe)
Then change the working directory to this folder:
cd "C:\Users\myuser\squish_license_usage"
Step 3 - Obtain the license server log entries in a file
When accessing the license server's log file on Windows directly, please note the above caveats.
Step 4 - Let the script generate the Excel file
Note that the Excel file will be created in the current working directory:
"C:\Users\myuser\Squish for Qt\python3\python" squish_license_usage.py "C:\ProgramData\Squish License Server\log\squish-license-server.log"
Example output:
Lines processed: 134
Writing: squish-license-server.log.my_squish_license_5.xlsx
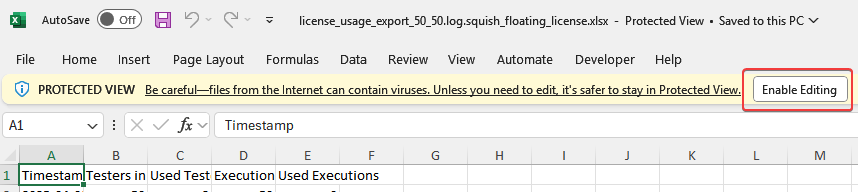
Step 5 - Open the Excel file in Microsoft Excel
If necessary (see near title bar of Excel), choose 'Enable Editing':
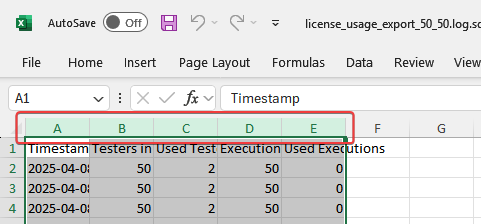
Step 6 - Select columns A to E
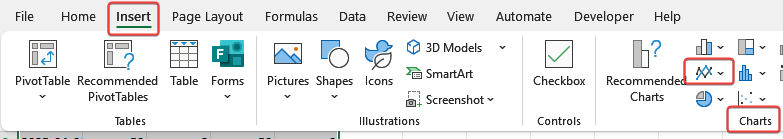
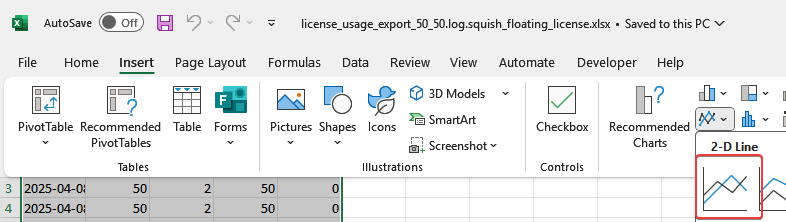
Step 7 - Click on menu Insert
Then click on ribbon item Insert Line or Area Chart (in section Charts):
Step 8 - Click the first 2-D Line item to insert the chart
Step 9 - Change size and position of the chart as desired